
EXECUTIVE SUMMARY
|
Dear Fellow Investors,
Broader markets remain expensive…
Markets continue their one way up-march and valuations in most of the pockets remain stretched. We look at two valuation ratios – price to sales and price to book – to show the extent of over-valuation. Price to sales indicates the ratio of market capitalisation of a company to its net sales. Price to book ratio compares the market capitalisation of the company to its net worth (or book value).
We are choosing these two ratios over the popular price to earnings (P/E) ratio because the denominator of P/E – earnings – can be influenced by cycles or extraordinary/ non-operating items and can be misleading. For eg., earnings of Banks, Oil and Gas companies and Public Sector Undertakings (PSUs) are at cyclical high today and their P/E look low. Sales and book values, instead, are more stable and can capture the extent of over/ under valuation better.
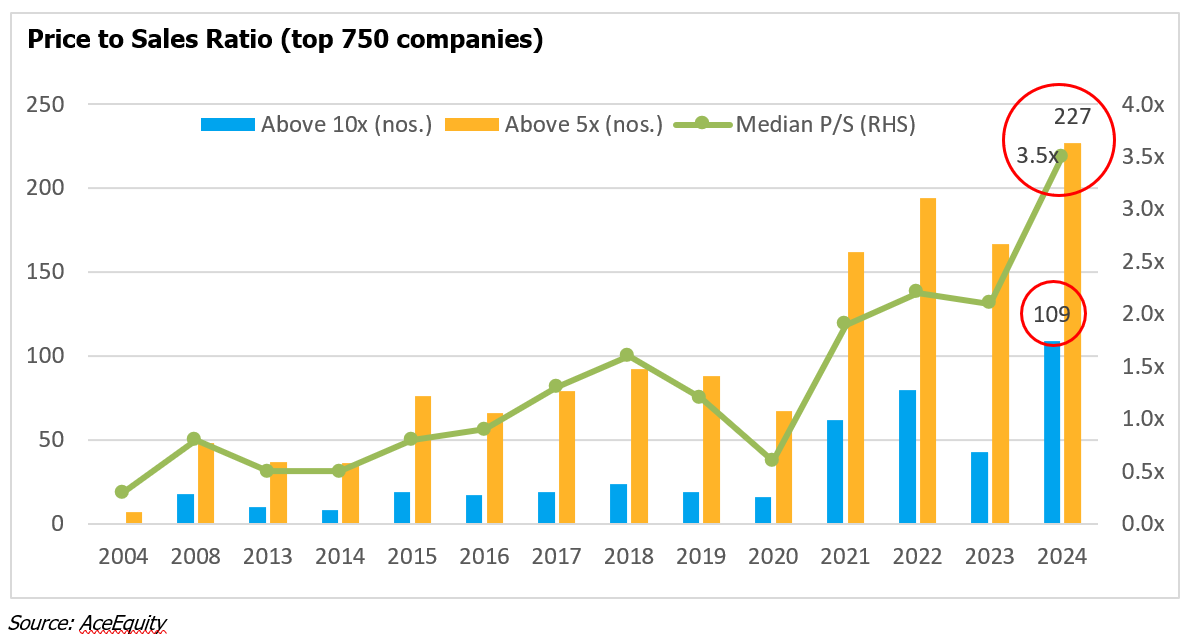
Price to Sales: Over 100 of the top 750 companies currently trade at price to sales of over 10x (versus an average of 25 companies in last 20 years) and over 220 companies trade at price to sales of over 5x (versus an average of 85 in last 20 years). Median price to sales ratio of top 750 companies is at 3.5x versus 20-year average of 1.1x.
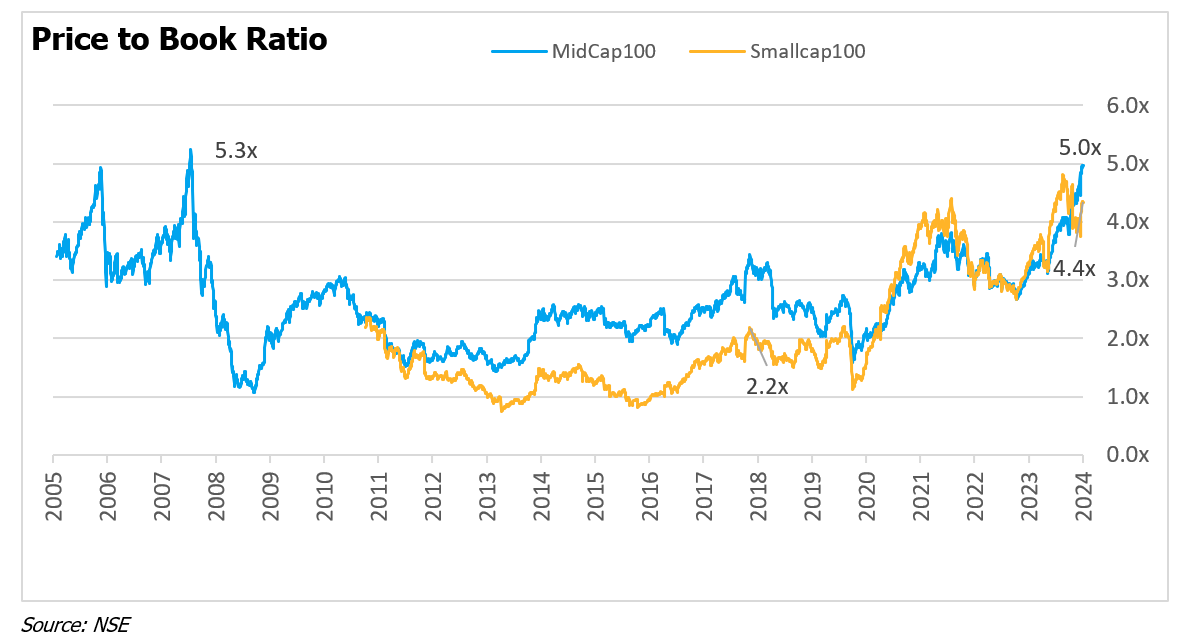
Price to book: Price to book ratio shows the stark over-valuation in small and mid-size companies. Nifty Midcap 100 and Nifty Smallcap 100 indices trade at 5x and 4.4x price to book ratios, higher by 100% and 153% over their decadal median. Nifty Midcap index is near its past peak of 2008. For the smallcap index, the P/B is twice of 2018 level. 2018 saw the previous smallcap bubble from where the index fell 20% in following 6 months.
…But we don’t know what will pause/ reverse the rally…
In 1996 when the NASDAQ was at 1300, Alan Greenspan (the US Federal Reserve Board chairman), said that the U.S. stock market was irrationally exuberant. NASDAQ kept going up for next 4 years to 5000 (>4x). And then crashed 80%.
Alan Greenspan was not wrong. Just early. Markets can remain irrational for longer than one can remain prudent.
Like every time before, it is difficult to predict the nature and timing of events that can trigger market meltdown today especially in India. The political, macroeconomic and microeconomic situation in India remains robust. Retail investors have balanced the volatility caused by foreign flows. However, we should not forget that inability to imagine the trigger doesnot mean we can avoid one. When valuations are high, margin of safety low, and the world interlinked to the extent as it is today, smallest adverse events can cause default, credit contraction, foreign exchange fluctuation, war or pandemic. In fact, these have been the triggers for past crashes.
So, what do we do….
How do we solve for this dilemma? We continue to stick to reasonably priced quality companies. In most bubbles including current one, there remain some pockets that are of good quality and are not as exuberant. We have been adding weights there (shared in this and past letters). Once our target weights are allocated to these positions, we park the balance in liquid/ arbitrage funds. On selling side, we will tolerate moderate overvaluations. We will trim gradually if overvaluation is very high.
This strategy, like every other strategy, is not full proof. If the markets were to crash tomorrow, our stocks will fall too. We have, with great care and discipline, built a quality portfolio which is reasonably priced. It is our belief, and history is a testament that such quality portfolio built at reasonable price will be first to recover. Moreover, our high spare cash will be useful in buying further. And if there is no crash, our incremental deployment will slow down due to lack of opportunities, cash reserves will build up, existing positions will continue to benefit and we may trim super expensive positions. STANCE: Cautious.
A. PERFORMANCE
A1. Statutory PMS Performance Disclosure
| Portfolio | YTD FY25 | FY24 | FY23 | FY22 | FY 21 | FY 20* | Since Inception* | Outper-formance | Cash Bal. |
| CED Long Term Focused Value (PMS) | 8.9% | 29.2% | -4.3% | 14.9% | 48.5% | -9.5% | 16.0% | 22.0% | |
| S&P BSE 500 TRI (includes dividends) | NA^ | 40.2% | -0.9% | 22.3% | 78.6% | -23.4% | NA^ | NA^ | NIL |
| *From Jul 24, 2019; Since inception performance is annualised; Note: As required by SEBI, the returns are calculated on time weighted average (NAV) basis. The returns are NET OF ALL EXPENSES AND FEES. The returns pertain to ENTIRE portfolio of our one and only strategy. Individual investor returns may vary from above owing to different investment dates. Annual returns are audited but not verified by SEBI. W.e.f. April 01, 2023 SEBI requires use of any one from Nifty50, BSE500 or MSEI SX40 as a benchmark. We have chosen BSE500 as our benchmark as it best captures our multi-cap stance. ^BSE has stopped sharing index values for time being. | |||||||||
Persisting with the discipline
We continue to focus on risk with a complete blind eye to quarterly returns in today’s heady times. This involves double checking our thesis every day, saying no to poor quality or expensive ideas and investing in acceptable positions gradually and fearfully.
Such has been the velocity of the markets currently that stocks that we have rejected due to subpar quality and/ or high price continue to rise relentlessly. The immediate emotional reaction, naturally, is of missing out. However, thanks to our direct and vicarious experiences, we have learnt to ignore these first impulses that the market like current one triggers.
A2. Underlying business performance
| Past Twelve Months | Earnings per unit (EPU)2 | FY 2024 EPU (expected) |
| Mar 2024 | 8.61 | 8.5-9.53 |
| (guidance was –>) | (7.5-8.5) | |
| Dec 2023 (Previous Quarter) | 8.0 | |
| Mar 2023 (Previous Year) | 5.9 | |
| Annual Change | 45.8% | |
| CAGR since inception (Jun 2019) | 15% | |
| 1 Last four quarters ending Dec 2023. Results of Mar quarter are declared by May only. 2 EPU = Total normalised earnings accruing to the aggregate portfolio divided by units outstanding. 3 Please note: the forward earnings per unit (EPU) are conservative estimates of our expectation of future earnings of underlying companies. In past we have been wrong – often by wide margin – in our estimates and there is a risk that we are wrong about the forward EPU reported to you above. | ||
Trailing Earnings: We had revised the Earnings Per Unit guidance for FY24 to Rs 7.5-8.5 last quarter. That was due to sale of two positions where earnings were at cyclical high. Actual trailing earnings per share for FY24 came in at Rs 8.6, marginally above the upper range of the guidance. Trailing twelve months Earnings Per Unit (EPU) of underlying companies, grew by 46% (including effects of cash equivalents that earn ~6%).
1-Yr Forward Earnings: We introduce FY25 forward earnings per unit guidance at Rs 8.5-9.5.
A3. Underlying portfolio parameters
| Jun 2024 | Trailing P/E | Forward P/E | Portfolio RoIC | Portfolio Turnover1 |
| CED LTFV (PMS) | 24.5x | 22.0x-24.5x | 34.0%3 | Nil |
| BSE 500 | 26.2x2 | – | 15.5%2 | – |
| 1 ‘sale of equity shares’ divided by ‘average portfolio value’ during the year to date period. 2Source: BSE. 3Portfolio Return on Invested Capital (RoIC) is on core equity positions. For BSE we share the RoE (Return on Equity) | ||||
B. DETAILS ON PERFORMANCE
B1. MISTAKES AND LEARNINGS
We continue to hold the arbitrage position in equity and preference shares of Music Broadcast (Radio City). The position remains in the money currently. There were no mistakes to report in this period.
B2. MAJOR PORTFOLIO CHANGES
Bought: We added to an existing position . It is now a 5% position (major position).
Sold: We did not sell anything in the reporting period.
B4. FLOWS AND SENTIMENTS
500x leverage in Weekly Options
India has seen sharp surge in derivatives volumes in last few years. India’s derivatives volumes accounted for over 80% of global derivatives volumes in April 2024. Last quarter, the average daily notional options volume of Nifty 50 contract in India (at 1.64trn$/ day) crossed that of US S&P 500 contract (1.44trn$/day). In fact, derivatives volumes are 400x of equity cash volumes in India, an all-time high both in India and the world.
The main contributor for this surge is weekly expiring options, also known as, zero-day options.
Option premium usually falls as time to maturity falls. Therefore zero-day option – that expires on the same day as bought – costs roughly one tenth of a traditional monthly-expiry options. One Nifty-50 zero-day option allows a buyer to have an exposure worth Rs 5 lacs by paying an option premium of just Rs 1,000 – a 500x leverage.
A 500x leverage magnifies gains and losses by 500 times. A 1% change in Nifty 50 can turn Rs 1000 into Rs 6000. Conversely even a 0.2% fall in Nifty-50 can wipe out the premium. Surprisingly, this leverage which has grown manifold remains uncaptured in periodic debt statistics – money supply, gross advances, debt to GDP etc.
For newer traders that have seen rising prices and low volatility, weekly options have been the goose that lays golden eggs. But in reality, these speculative instruments are more like collecting pennies on a busy highway, or living in a rent-free home in a high-seismic zone. Once the prices start falling, most of the retail traders will incur capital losses.
—–
Taking Temperature
We use some qualitative indicator to take the temperature of markets and get hints of where are we in the cycle.
Retail and HNI investors continue to chase past performance. Capital market flows remain extremely buoyant as evident from multiple data points:
- In last twelve months, of the INR 2.3 trn that flew into equity mutual funds (MF), over 50% went into smallcap, midcap and thematic funds which were already very expense. A sizable part of these MF inflows came from new fund offers (NFOs). NFOs are launched when the theme has already done well. No surprise that around 60% of NFOs have underperformed their benchmarks in last 3 years.
- IPO pipeline (Hyundai, OLA Electric, Bajaj Housing etc.) is indicating 2024 will again record near all-time high collections.
- SME IPOs continue to break records in terms of number of issues, extent of oversubscription, amount raised and listing pops. Versus Rs. 4900cr in CY2023, SME IPOs have already raised Rs. 3600cr in first half of CY2024. Also, the SME IPO index is up 250% in last 12 months! Most of the underlying companies have ordinary businesses and unknown corporate governance history.
- Promoters and insiders continue to offload their stakes and cash out at loft vallations. Over 440 promoters have sold stakes worth Rs 62,000 cr in the first half of CY2024, highest since 2019.
Another interesting data point to look at is Skyscraper construction. The underlying theory is that many of the iconic skyscrapers of past have coincided with top of financial cycle. The Empire State Building in New York City was started in 1929. The Petronas Twin Towers in Kuala Lumpur were started in 1993. The Jailing Tower in Shanghai was started in 1995. Burj Khalifa was finished at the height of the market collapse in Dubai. In India, Imperial I &II (840ft each), the then tallest buildings, were built in Mumbai in 2010. Over 30 skyscrapers (600ft+ height) have been completed in last 3 years in Mumbai. Construction of even taller buildings (Ocean Power 1&2 1086ft, Aaradhya Avaan, 1000ft high) are underway right now.
C. OTHER THOUGHTS
Manias and Panics – Lessons from last 400 years
“I can calculate the movement of stars, but not the madness of men.”
Sir Issac Newton (after losing money in the South Sea Bubble, 1720)
Financial bubbles and crashes have been a frequent occurrence throughout the recorded world history. Almost all have led to bankruptcies, job losses, and financial distress. If meltdown of bubbles is so painful, why can’t we stop them? Won’t it be better if prices remain etched to the financial worth of underlying securities/ assets, and owners earned the natural yields of those assets?
We scanned over 10 episodes of bubbles and crashes of last 400 years – including Tulip Mania of 1636, the Great Depression of 1929, the Dot Com bubble of 1999, the Sub-prime crisis of 2008 etc – to try and understand the causes of bubbles and crashes. The objective was to pull out/ revise lessons that today’s enthusiastic investors can learn from and avoid similar mental and financial toil.
Initial Rational Source: In almost all the bubbles of last 400 years, one or more of the following were the initial source(s) of economic exuberance:
| SN | Initial Rational Sources | Examples |
| 1 | Inventions/ Productivity growth | o US 1920s (railways, radio, automobiles),
o US Tech Bubble 1990s (internet) |
| 2 | Expansion of credit, excessive leverage, easy money, low interest rates | o Japanese Real Estate 1980s,
o US Subprime Crisis 2000s, o Global Venture Capital boom 2015-2022 |
| 3 | Globalisation, exports, cheap currency | o Japanese Real Estate 1980s,
o South East Asia 1990s, o China 2000s |
| 4 | Economic Reforms/ Liberalisation | o Mexico 1980s,
o US abandoning the Gold Standard 1970s, o India Harshad Mehta episode 1990s |
| 5 | Monopolies | o South Sea Bubble 1720,
o Mississippi Bubble 1720 |
Most of the above measures were taken in pursuit of progress and economic well-being. And most of these measures were justified reasons for imagining a brighter future. They did improve lives and general wealth.
Wealth Effect: Anticipation of higher demand and growth due to above initial events leads to rise in asset prices. Banks get comfortable lending funds against security of these inflating assets. Raising money through equities become cheaper. Easy availability of both debt and equity capital at low cost of capital encourages capital investments and job creation. This raises incomes and thereafter consumption. The wealth effect thus feeds itself.
Greater Fool Theory: What turns initial optimism into euphoria and bubble is the over estimation of brighter future, animal spirits and emotional outburst of greed, envy and fear of missing out (FOMO). Wealth effect leads to general sense of prosperity. It triggers envy and FOMO among sideliners. Prices start to detach from underlying reality. People buy in the hope that others may buy from them at even higher price – the Greater Fool Theory. Indian smallcaps, midcaps and a few sectors seem to be going through this stage currently.
Timing the top: Sadly, sooner or later the supply of greater fools run out. Some external event happens that makes prices to first stop rising and then start falling. Those not able to service debt or expenses are forced to liquidate falling assets. Gradually greed turns to fear and wisdom of crowds turns into stampede of folly. If we try to pick clues about being able to time the peaks, we will return disappointed. For, there is no upper range of time in months when a bubble pops. However, sooner or later, it does pop. Following have been one or more common crash triggers/ escalators of the past:
| SN | Crash Triggers/ Escalators | Examples |
| 1 | Frauds or Swindles | o Enron/ Worldcom During US Tech Bubble 1990s,
o Satyam, India 2008 |
| 2 | Default or Bankruptcies | o US Maring Debt 1920s,
o South East Asian Crisis 1997, o Lehman Brothers 2008, o IL&FS default 2018 |
| 3 | Contraction of credit or money supply | o Japanese Real Estate 1980s,
o US Tech Bubble 1990s |
| 4 | Geo-Politics, Terrorism, War | o Yom Kippur War and Oil Crisis 1973,
o 9/11 Attack 2001 |
| 5 | Natural Calamities including Pandemics | o Spanish Flu, 1918,
o Covid -19, 2020 |
Saviour: Primary protection against emotional follies of envy, greed, fear of missing out and overconfidence in an overheated market is to remember what Benjamin Graham and Warren Buffett said about bubbles and human nature –
“The investor’s chief problem, and even his worst enemy, is likely to be himself”
“Be fearful when others are greedy”
***
As always, gratitude for your trust and patience. Kindly do share your thoughts, if any. Your feedback helps us improve our services to you!
Kind regards,
Team Compound Everyday Capital
Sumit Sarda, Surbhi Kabra Sarda, Punit Patni, Arpit Parmar, Sanjana Sukhtankar and Anand Parashar
————————————————————————————————————————————————————————————————-
Disclaimer: Compound Everyday Capital Management LLP is SEBI registered Portfolio Manager with registration number INP 000006633. Past performance is not necessarily indicative of future results. All information provided herein is for informational purposes only and should not be deemed as a recommendation to buy or sell securities. This transmission is confidential and may not be redistributed without the express written consent of Compound Everyday Capital Management LLP and does not constitute an offer to sell or the solicitation of an offer to purchase any security or investment product. Reference to an index does not imply that the firm will achieve returns, volatility, or other results similar to the index.