Letter to Investors – Mar’25 – Extracts


EXECUTIVE SUMMARY

    • Trailing twelve months’ earnings of underlying portfolio companies grew by 15%. 
    • NAV grew by 10.3% with 79% funds invested in equity positions. Balance 21% is parked in liquid/ arbitrage funds.
    • Nearly half of the top 700 companies are trading at over 40x P/E, building in lofty expectations.
    • We added further to two existing positions. We exited from one older position (details in the letter).
    • Tariffs and Artificial Intelligence calls for being more demanding in multiples we pay for equities.
    • Investment beliefs are shaped by the era that investors spend their early investment years in.
    • Stance: Neutral

Dear Fellow Investors,

High expectations (valuations) steal the joys of life (investing) 

Stock prices reflect future expectations. The higher the expectations, the lower the room for positive surprise—both in life and investing. When valuations are stretched, the risk of disappointment rises, making aggressive investments at elevated prices a potential recipe for regret.

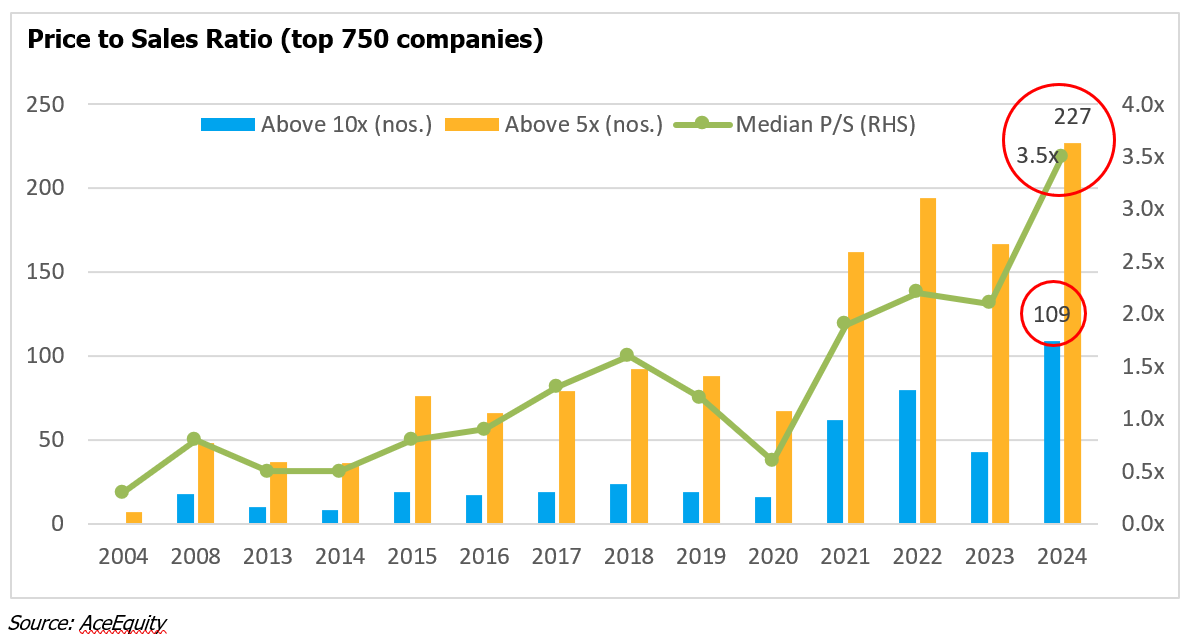
As of 31st March, about 50% of the top 700 companies (market cap > Rs 5,000cr) traded at or above 40x trailing price to earnings (P/E) ratio (including loss making companies). This is after some moderation from Sep 2024 highs when that count was over 60%.  Average P/E of BSE 500 index has been around 22x for past two decades.

A 40x P/E roughly builds in an expectation of an 18% annual free cash flows growth for a decade, followed by 5% growth for the next 90 years. At 100x P/E, those expectations rise to 25% and 8%, respectively—expectations that nearly 10% of these companies are pricing in today! 

Of these 40x+ P/E companies having listing history of 10+ years, only 20% have been able to grow their earnings at or over 18% for last 10 years. The median 10-year earnings growth of these companies has been 15%. A caveat here – many sectors are at their cyclical top – for example PSU banks, railways, defence, capital goods, real estate, power, oil & gas, hospitals, hotels, capital market facing firms etc. There are high chances that the median future 10-year earnings growth for this cohort will be lower than 15%.

Sustaining high growth for decades requires two ingredients—moat and demand. Moat or competitive advantage refers to entry barrier(s) that provides protection against competition, while demand determines the size of the opportunity. Of the two, moat is essential. Without a moat, rapid growth attracts competitors, squeezing margins and returns. Even if this is temporary, picking ultimate winner becomes difficult.

Today, Indian companies trading at or above 40x P/E span diverse sectors – auto and auto-ancillary, paints, wires and cables, quick commerce, airlines, hospitals, hotels, footwear, clothing, retail, luggage, solar, wind, jewellery, FMCG, QSR (quick service restaurants), electrical appliances, salty snacks, writing pens, plastic products, commodity chemicals etc.

Many of these sectors have no, narrow, or weakening moats. Two broad factors are driving such high valuations:

1. Overestimating fundamentals:

  • Misjudging growth: Cyclical/ temporary growth is misjudged as structural tailwind (e.g., the Indian chemical sector post-2014, COVID-driven demand spikes in healthcare, capital goods due to government capex etc.).
  • Overestimating market size: Many consumer categories in India have a smaller actual market than initial optimism suggests. Also, a part of consumption is fuelled by unsustainable debt.
  • Weakening competitive advantages: Technological shifts and new distribution models (e-commerce, quick commerce) have weakened moats in many sectors including FMCG, retail, consumer durables, and quick service restaurants (QSRs). Artificial Intelligence may also disrupt moats in future.
  • Growth attracting competition: High-growth sectors such as telecom, paints, wires, airlines, retail, and diagnostics have seen new entrants dilute profitability.
  • Overestimating management quality– Great managements protect and/ or strengthen the moat through culture, capital allocation and efficient execution. Without moat, however, their abilities to protect growth and profitability is reduced (passenger vehicles for example). The subset of businesses, where management is the moat (banking and general insurance for example) is small. Outside of this set, giving high multiples for business lacking strong moat only because of quality management may lead to overvaluation.
  • Regulatory tailwinds – Regulations or government protection can give temporary bouts of growth (eg, public capex, license etc); however, regulations and governments can change. Price curbs or caps can be introduced in consumer interests (eg telecom, real estate, micro finance, city gas distribution etc.).

2. Flows driving prices: Often non-fundamental reasons like global and local flows (due to momentum, index inclusion, or lack of alternative opportunities) can drive prices. The current episode of buoyant prices in India can partly be attributed to unprecedented flows from retail investors further supported by ease of trading and positive narratives painted by media and fund managers. In such an environment, price movements become shorthand for quality, and the belief that “rising prices equal strong fundamentals” can take hold. This creates a self-fulfilling prophecy where valuation metrics and underlying business fundamentals are overshadowed by the prevailing market sentiments.

In the short run, imaginations can continue to run wild and valuations can stretch beyond reason. However, the maths ultimately needs to add up. Time ultimately acts as a reality check. If growth, profitability or capital intensity turns out weaker than lofty expectations, price resets can be sharp.

Investing involves looking into the future and many times it is not that easy to judge the nature of moat and future growth. These are all the more reasons to demand margin of safety.

Markets fell from their Sep’24 highs and they recovered some ground in the month of March. As of writing of this letter, US tariffs have led to fall across markets including India. While valuations in many pockets continue to imply unreasonably high expectations, some entry points have emerged. Changing the stance from Cautious to Neutral.


A. PERFORMANCE


A1. Statutory PMS Performance Disclosure

Portfolio FY25 FY24 FY23  FY22 FY 21  FY 20* Since Inception* Outper-formance Cash Bal.
CED Long Term Focused Value (PMS) 10.3% 29.2% -4.3% 14.9% 48.5% -9.5% 14.0% 21.0%
S&P BSE 500 TRI (includes dividends) 6.0% 40.2% -0.9% 22.3% 78.6% -23.4% 17.2% -3.2% NIL
*From Jul 24, 2019; Since inception performance is annualised; Note: As required by SEBI, the returns are calculated on time weighted average (NAV) basis. The returns are NET OF ALL EXPENSES AND FEES. The returns pertain to ENTIRE portfolio of our one and only strategy. Individual investor returns may vary from above owing to different investment dates. Annual returns are audited but not verified by SEBI. 


Risk is under our control, not returns

The above statutory performance table captures returns but not risks. That’s because risk isn’t a neatly quantifiable number that can be benchmarked periodically. Yet, managing risk—not predicting returns—is the one aspect of investing firmly within our control. A simple but difficult way to do so is by focusing on the quality of the businesses we own and the price we pay for them. And, in absence of either, waiting for them by parking the cash in liquid and safe instruments.

The secret in equities is that in long term, low risk can lead to moderate to high returns for most investors, but high risks lead to lower returns for most investors. Operating word is “most”. A few may achieve extraordinary short-term success through sheer luck or randomness, but for the vast majority, the only dependable way to earn satisfactory returns is through consistent risk management.

However, much like vaccines or insurance, risk control often feels unnecessary in investing. As long as things are going well, all three seem like an avoidable cost, a needless drag. But their true value becomes clear when uncertainty strikes. The prudent approach is to spread this cost over time, rather than defer it, because risks, when ignored, can compound and strike with fatal force.

Investors got a glimpse of this in the latter half of FY 2024-25. For many newer participants, the market correction may have been a shock. But for experienced investors, it was not unexpected. We had been preparing—not by making dramatic market calls, but by being cautious and accepting smaller, more manageable doses of discomfort: the pain of underperforming and looking out of sync when euphoria prevailed. Our higher cash equivalents amid lack of meaningful opportunities over last few years was a result of this caution. It took its toll in terms of lesser relative returns. But that’s a far better price to pay than the alternative—finding oneself out of money, conviction, or emotional strength when the tide turns.


A2. Underlying business performance


Past Twelve Months Earnings per unit (EPU)2 FY 2025 EPU (expected)
Dec 2024 9.21 8.5-9.53
Sep 2024 (Previous Quarter) 8.9 8.5-9.53
Dec 2023 (Previous Year) 8.0
Annual Change 15.0%
CAGR since inception (Jun 2019) 13.0%
1 Last four quarters ending Dec 2024. Results of Mar quarter are declared by May only. 2 EPU = Total normalised earnings accruing to the aggregate portfolio divided by units outstanding. 3 Please note: the forward earnings per unit (EPU) are conservative estimates of our expectation of future earnings of underlying companies. In past we have been wrong – often by wide margin – in our estimates and there is a risk that we are wrong about the forward EPU reported to you above. 


Trailing Earnings: So long as we do not overpay, our returns will track or exceed the earnings growth of our underlying companies. We track the earnings available to per unit of PMS through Earnings per Unit (EPU) metric. This is calculated by taking normalised earnings accrued to our portfolio divided by PMS units. For the trailing twelve months ended Dec 2024, our EPU came in at Rs 9.2 per unit, higher by 15% year on year.


1-Yr Forward Earnings: We retain our EPU guidance for FY25 at the range of Rs 8.5-9.5 per unit.


A3. Underlying portfolio parameters


Mar 2025 Trailing P/E Forward P/E Portfolio RoIC Portfolio Turnover1
CED LTFV (PMS) 23.0x 22.3x-24.8x 37.0%3 11.7%
BSE 500 23.4x2 16.5%2
1 ‘sale of equity shares’ divided by ‘average portfolio value’ during the year to date period. 2Source: Asia Index. 3Portfolio Return on Invested Capital (RoIC) is on core equity positions. For BSE 500 index we share the RoE (Return on Equity)


B. DETAILS ON PERFORMANCE

B1. MISTAKES AND LEARNINGS

There were no mistakes to report in this period.


B2. MAJOR PORTFOLIO CHANGES

Bought: We added to two existing positions. 


Sold: We have completely exited from CDSL at 8x gain from our average cost.


CDSL Exit (8x gains) and Learnings

In our past letters, we’ve shared our approach to selling—while we tolerate some overvaluation as long as fundamentals remain stable, we reassess when they weaken. In the case of CDSL, we believe the fundamentals are now weakening.

CDSL’s revenue is significantly tied to equity market activity, including cash market deliveries, IPO applications, corporate actions (rights issues, bonuses, buybacks, etc.), and KYC transactions. A bull market of last four years has helped CDSL increase its profits by 3.3x. However, as markets declined 7-9% in the December quarter, CDSL’s revenue growth slowed. Given CDSL’s high fixed-cost base, profit after tax (PAT) grew even more slowly than revenue.

Looking ahead, we expect India’s exceptionally high retail participation—up 3-10x over the past four years—to moderate as market valuations remain elevated and volatility increases. Meanwhile, fixed costs like employee and technology expenses will remain sticky, putting further pressure on profitability. At the price we exited, forward valuation multiples looked demanding in this context.

We have exited our CDSL position with an 8x gain over five years. CDSL allowed us to experience, first hand, the power of duopoly, capital-light businesses and impact of mega trends—surge in retail investor participation in this case. Hopefully, we will over allocate to such cases next time. For now, it goes back to our watchlist.


B4. FLOWS AND SENTIMENTS

Smallcap and midcap equity indices fell 16 and 11% respectively last quarter, despite continued positive inflows into smallcap and midcap mutual funds. The decline was driven by selling from foreign and high-net-worth investors on thin volumes rather than a slowdown in domestic fund flows.

This correction has tempered excessive bullishness in riskier market segments—a welcome development. However, if retail investors start redeeming from mutual funds, liquidity constraints could amplify the downturn. On the other hand, sustained inflows might mark a bottom. As always, timing is uncertain, and with valuations still elevated, caution remains key.

Globally, trade tensions are back in focus, with the return of US tariffs under President Donald Trump. Trade policies are unpredictable, and history suggests that protectionism often leads to economic inefficiencies and, in extreme cases, geopolitical instability. While growth slowdown and inflation concerns in the US may limit aggressive escalation, the risk of negative surprises has risen.

Meanwhile, artificial intelligence (AI) is reshaping the technology landscape. US tech giants are investing heavily in AI infrastructure, while Chinese firms like DeepSeek and Baidu are emerging contenders. As with past technological revolutions—railways, radio, automobiles, and the internet—the winners remain uncertain. AI’s impact on healthcare, mobility, security, and automation presents both opportunities and disruption risks.

Both tariffs and AI add to global uncertainty, reinforcing that we remain demanding of multiples we pay for equities.


C. OTHER THOUGHTS

Market Eras and Investment Beliefs

Beliefs are shaped by direct and vicarious experiences – both in life and investing. Market regime/ era that investors live through influence their risk appetite, valuation frameworks, and core investment beliefs. Here are some of the historical investing eras:

  • The 1930s and the Great Depression: The 1929 crash in the US led to prolonged stagnation, with U.S. stocks not recovering for 25 years. Investors from this era viewed equities as risky, favouring bonds, dividends, and capital preservation.
  • The Inflationary 1970s: High inflation during 1970s in the US compressed valuations and led to negative real returns. Bonds and commodities became preferred investments, reinforcing inflation sensitivity among investors of that era.
  • The Great Bull Market (1980–2020): 40 years of falling interest rates fuelled a multi-decade bull market, driving valuations higher and benefiting long-duration assets like technology stocks. Passive investing and private equity thrived, while ‘buying the dip’, became a reliable strategy.
  • The Japanese Equity Winter (1990–2020): Japan’s post-real-estate-bubble stagnation left investors conservative, prioritizing cash preservation. Even decades later, Japanese households remain underweight equities despite global market strength.
  • India’s ‘Lost Decade’ (1992–2001): After the Harshad Mehta crash, the Sensex remained flat for nearly a decade, fostering scepticism toward equities. Many Indian investors turned to fixed deposits (FD rates were over 12%), real estate, and gold, delaying the cultural shift toward equity investing until the mid-2000s.

Those who have lived in declining or stagnant markets develop cautious attitude and those having lived through bullish times develop a carefree attitude to investing. Much like Plato’s allegory of cavemen, these attitudes are so strong that it is difficult to convince them that other eras exist. In The Republic, Plato shares a story about a group of people who lived their entire lives chained inside dark cave facing a wall. Behind them was a fire, and between the fire and the prisoners was a walkway. On this walkway, others carried objects, puppets, and shapes, casting shadows on the wall in front of the prisoners. When one of the cavemen escaped and discovered the real world, his attempts to enlighten the others were met with disbelief and resistance.

India’s Post-Pandemic Boom (2020–2024): Of the 20 crores demat accounts live today in India, 15 crores (75%) were opened in the last four years. Many of these investors have only seen a rising market, believing 20% annual returns are the norm. Veteran investors, who have experienced multiple cycles, warn against such high expectations. But much like the cave prisoners dismissing the freed man, such advice falls on deaf ears.

Common themes and thinking about current Era

While it is nearly impossible to predict start or end of an era, one commonality is that like night following day, bullish eras have been followed by bearish ones and vice versa. The duration of either of them is unpredictable. However, aspects like peace, free markets, capitalism, technological progress elongate a bullish era. India has a great future if we look at these factors barring the high valuations. While this in itself does imply an era of falling or stagnant prices, past does warn us not to take good times for granted.


***

As always, gratitude for your trust and patience. Kindly do share your thoughts, if any. Your feedback helps us improve our services to you!

Kind regards

Sumit Sarda

Partner and Portfolio Manager

————————————————————————————————————————————————-

Disclaimer: Compound Everyday Capital Management LLP is SEBI registered Portfolio Manager with registration number INP 000006633. Past performance is not necessarily indicative of future results. All information provided herein is for informational purposes only and should not be deemed as a recommendation to buy or sell securities. This transmission is confidential and may not be redistributed without the express written consent of Compound Everyday Capital Management LLP and does not constitute an offer to sell or the solicitation of an offer to purchase any security or investment product. Reference to an index does not imply that the firm will achieve returns, volatility, or other results similar to the index.


Continue Reading

Immediate Vs Delayed Outcomes

Often we judge the success of an activity by its outcome. We run a sprint, we know at the end who has won. We write an exam, results in few hours/weeks tell us how we did. When outcome is immediate, cause and effect relationship is easy to understand.

However, this outcome based evaluation can mislead if the outcome occurs, not immediately, but over long periods of time. More so, if immediate outcomes are different from long term outcomes. Consider healthy eating. Giving away junk food for healthier alternatives look painful today but is beneficial in longer run. Or consider working out. Going to the gym looks a chore in near term but immensely beneficial eventually. Conversely, smoking or gambling may feel great in the near term but are harmful over longer term.

For such activities with longer term outcomes, a judgement based solely on immediate outcomes – healthy eating or workouts are undesirable, smoking or gambling are desirable – will be wrong.

Investing is more like the latter set of activities. There is an element of luck in the near term which can lead to false positives – great returns despite buying wrong things; or false negatives – poor near term returns despite correct process.

If the immediate outcome of an activity is poor, how do we know for sure that we need to stop or continue that activity? We need to look at historical evidence of longer term effects. And we need to ask whether it makes sense in longer term.

Continue Reading

Buy High. Sell Low. Repeat. Go Broke

Nothing is as financially ruinous as consistently buying high and selling low. Yet we see it happening all the time. Ignorance, emotions, and miss-selling interact with each other to powerfully induce this folly.

Without a sense of a company’s worth, it is impossible to judge whether its share price is high or low. Assessing that worth requires understanding of underlying business and many investors donot have time, interest or ability to do it. Price trend is generally used as a substitute for this ignorance about intrinsic value. Companies seeing price rising are considered as good and vice versa. When more people believe in this momentum, it becomes a self-fulfilling prophecy. Ignorance encourages buying assets that are rising.

Nothing intoxicates human mind as rising prices. Rising prices trigger emotions of envy, FOMO (fear of missing out) and greed. Those sitting on side-lines get interested. And those making money feel invincible and take more risks even on leverage.

Times of rising markets is business-season for many “experts” – distributors, advisers, brokers, merchant bankers etc. Sadly, financial incentives of almost all “experts” are linked to selling financial products – stocks, mutual funds, IPOs, insurance policies – and not good outcomes for investors. This leads to miss-selling. Mutual funds, life insurers and capital raising companies paid over INR 37,000cr (rough conservative estimate) worth of commissions in 2021 to these “experts”. This was paid without any linkage to the buyers’ returns from the financial products sold.

When willingness to buy during rising prices is met by advice that pays the advisor for selling expensive products, it creates a powerful force to buy high.

The same story reverses when prices fall. In absence of sense of intrinsic value most investors fail to assess whether paper losses are temporary or permanent. Momentum and emotions trigger a rush for the door. And those “experts” who peddled the products during rising prices either disappear or are not heard.

Here’s a crude antidote to this: When past returns of an asset class are high, ignore all temptations and “expert advice” of even higher returns. Conversely, when past returns of an asset class are low or even negative, ignore anything that stops you from investing. Lastly, when taking help from “experts”, see that they are remunerated for results, not selling products. When you get a call from a life insurance agent, just hang up!

Continue Reading

Test match Vs T20 match

10 Overs, 40 runs, 0 wickets. How’s this for a first innings cricket match score? You will rightly ask – What’s the format of this game? It’s a bad score for a twenty-twenty (T20) match, average score for a one day (ODI) match and a decent score for a test match. And if it’s indeed a test match with bouncy pitch, overcast conditions and the best bowling unit in the world – you will say it’s a fantastic score.

In cricket and in investing, it’s impossible and, even, unfair to judge a score without knowing what format of the game it is. What’s good for T20 may be bad for test matches. What’s good for momentum trading may be bad for long term investing.

We are playing a test match and not a T20. The key to success – both in test match batting and long term investing – is to leave or defend the balls that are risky. And, hit only when the ball is in the sweet zone.

This investing sweet zone for us is buying sustainable businesses, run by able and honest management, at reasonable prices. And so long the ball is not in this zone – either the business and/or management and/or price are bad, we wait, and wait and wait. For that juicy half volley or full toss right in our zone. They normally come.

T20s are more popular than test matches. Similarly, short term investment horizon and momentum based trading are more common than long term horizon and value oriented investing. Popular attention is focussed on what’s going to happen next day, week or month in markets. This should not let us forget that we are playing a different game

Continue Reading

Envy, FOMO and Greed

It’s agonisingly difficult to stay on sidelines as stock prices rally. Every day’s rise, calculable from daily prices, reminds of returns forgone. And, if friends, family and neighbours are gloating about it on social media, the chance of staying cautious amidst rising prices is close to nil.

Envy and fear of missing out (FOMO) are evolutionary emotions that supported survival of human beings. It propelled our hunter forefathers into action and ensured that they were not staying behind in the survival queue.  So is greed. There were survival benefits in over eating or storing excess food or accumulating things beyond immediate need. We inherited these emotions as their legacy.

Envy and FOMO pushes those staying on sidelines to participate in a rising market, often at the top. And greed pushes those who are making money to continue chasing rising prices often on leverage (trade on borrowed money/ margin). This fuels feel good emotions and a feedback loop. Sadly, financial history shows that what cannot go on forever, will stop someday. While good for survival; envy, FOMO and greed are hazardous during investing.

You will be attracted to narratives about how things are different these times and time to make money is now. The origins of these narratives are often from those who get their payday selling part or full of assets/ companies. When someone comes to you with a deal, check how is he/she getting remunerated.

Most of the times, most of the prices donot go in one direction. What’s wise at one price, is foolish at another. Plan of buying assets in hope of passing it on to a greater fool can backfire when supply of greater fools run out and one ends up holding the can.

The only antidote against succumbing to envy, FOMO and greed in investing is a sense of intrinsic value and discipline to wait if prices donot leave a sufficient margin of safety against bad luck or error. Both of these – sense of intrinsic value and discipline – come from an understanding of underlying assets/ businesses. Avoid poor businesses &/or poor managements &/or poor prices. And one can avoid many mistakes.

Continue Reading

Volatility and Bargains (reminder during bear markets)

The key to discovering bargains is an understanding of value/ worth of a business. Prices often over or undershoot conservatively assessed value for various reasons. Future uncertainty and over reaction to continuing developments is one of the sources of this volatility.

Since the launch of the BSE Sensex in 1986, India has witnessed five events of seismic proportions – the 1991 Economic Liberalisation, the 1997-98 Asian Crisis, the 2000 dot-com bubble, the 2008 sub-prime crisis and the 2020 Covid-19 pandemic. Market movements during each of those times were characterised by very high volatility – rising and falling over 50% in short term. Even after these upheavals the Sensex has compounded by 16%  annually (including dividends) in the last 32 years.

One key factor in climbing these walls of worries has been human tendency to fight, survive, adapt and prosper. The need to keep improving one’s life conditions amidst all hardships will always exist – more so in India today as it stands at under 2500$ per capita GDP. So long India remains a democratic nation and a free market economy, good businesses that can cater to the demand of a prospering India profitably will prosper.  All we have to do is buy sensibly without overpaying. Volatile periods will be an opportunity to do just that.

Continue Reading

Humility & Conviction

Psychology plays an important role in investing. A crucial component of investment psychology is the delicate balance between humility and conviction. In investing, we deal with future. Assessment of future outcomes and their probabilities requires humility – acknowledgment of the fact that we may not know everything and what we know may turn out to be wrong.  Just humility will, however, lead to nowhere. Even after factoring in the possibilities of being ignorant and wrong, if Mr. Market provides an opportunity, we got to be ready to act with conviction.

The importance of this delicate balance between humility and conviction should shape one’s investment behavior.

Humility translates into various aspects of investment process namely – conservative assessment of value, investing with a margin of safety, diversifying, willingness to hold cash and sit tight when opportunities abate. To gain conviction, one needs to understand the underlying business, have a long term orientation and bet strongly when odds are in favour.

Continue Reading

Overcoming Fear

If there is one thing that can get in the way of our shared path of wealth creation, it is fear. And if there is one thing that will collectively make us better investors, it is overcoming fear. It is during the darkest hour of fear that greatest bargains are found. And during those times our greatest mistake would be selling instead of buying or holding.

The main cause of fear is that normally when stocks are falling, everything else is falling too including cash and confidence. There are no landmarks or shady trees to take shelter under. Investors would take out money from stocks to meet other expenses/ liabilities. We cannot be fearless just by deciding not to be fearful. We need antidote that works.

The only antidote to fear from price fall is to PREPARE FOR BAD TIMES; to arrange our affairs in such a manner that we are not hard pressed for cash during recessions. 

Continue Reading

Difficulties of Being in a Bull Market


“I don’t predict future. I understand human nature”

-Lord Krishna to Arjun in The Mahabharata

Thanks to our genetic wiring; envy, greed and fear (of losing out) are three primary human emotions every bull market stimulates. We acknowledge usefulness of these human emotions. Emotions including envy, greed and fear have been instrumental in human survival and superiority over other species since life’s origin. Being envious forced us to compete and improve. Being greedy made us accumulate and overcome scarcity. And, being fearful triggered the fight/ flight responses necessary for survival. These emotions therefore, with generations, are so etched into human consciousness that they operate automatically and indiscretionally, including, in a bull market. Unfortunately, going by financial markets’ history, these emotions when drive actions, lead to bubbles and crashes.

Focus, however, has to be on business value all the time; especially during bullish times. During bullish phases, envy, fear of losing out and greed sets in. Prices get higher and opportunities reduce. By not chasing momentum, a careful investor is bound to see temporary and reversible periods of underperformance. Being patient is never easy, especially if your neighbour is getting richer in a bull market. But this is exactly what one needs to try to do! This approach is better than chasing hot stocks and burning fingers in next correction. A thoughtful investment approach focuses at least as much on risk as on return. Whenever it has been easy to make money in equity markets, it has been even easier to lose it. Earning 16% for 10 years each will leave one with more money than earning 20% in 9 years each and losing 15% in the 10th.

Continue Reading

Letter to Investors – Jun’24 – Extracts


EXECUTIVE SUMMARY

    • Trailing twelve months’ earnings of underlying portfolio companies grew by 46%.
    • NAV grew by 8.9% YTD with 78% funds invested in equity positions. Balance 22% is parked in liquid/ arbitrage funds.
    • Solving dilemma of investing in a one-way rising market.
    • We added further to an existing position to make it a major position (>=5% weight).
    • Lessons from manias and panics of last 400 years.
    • Stance: Cautious

Dear Fellow Investors,

Broader markets remain expensive

Markets continue their one way up-march and valuations in most of the pockets remain stretched. We look at two valuation ratios – price to sales and price to book – to show the extent of over-valuation. Price to sales indicates the ratio of market capitalisation of a company to its net sales. Price to book ratio compares the market capitalisation of the company to its net worth (or book value).

We are choosing these two ratios over the popular price to earnings (P/E) ratio because the denominator of P/E – earnings – can be influenced by cycles or extraordinary/ non-operating items and can be misleading. For eg., earnings of Banks, Oil and Gas companies and Public Sector Undertakings (PSUs) are at cyclical high today and their P/E look low. Sales and book values, instead, are more stable and can capture the extent of over/ under valuation better.

Price to Sales: Over 100 of the top 750 companies currently trade at price to sales of over 10x (versus an average of 25 companies in last 20 years) and over 220 companies trade at price to sales of over 5x (versus an average of 85 in last 20 years). Median price to sales ratio of top 750 companies is at 3.5x versus 20-year average of 1.1x.


Price to book: Price to book ratio shows the stark over-valuation in small and mid-size companies. Nifty Midcap 100 and Nifty Smallcap 100 indices trade at 5x and 4.4x price to book ratios, higher by 100% and 153% over their decadal median. Nifty Midcap index is near its past peak of 2008. For the smallcap index, the P/B is twice of 2018 level. 2018 saw the previous smallcap bubble from where the index fell 20% in following 6 months.


…But we don’t know what will pause/ reverse the rally…

In 1996 when the NASDAQ was at 1300, Alan Greenspan (the US Federal Reserve Board chairman), said that the U.S. stock market was irrationally exuberant. NASDAQ kept going up for next 4 years to 5000 (>4x). And then crashed 80%.

Alan Greenspan was not wrong. Just early. Markets can remain irrational for longer than one can remain prudent.

Like every time before, it is difficult to predict the nature and timing of events that can trigger market meltdown today especially in India. The political, macroeconomic and microeconomic situation in India remains robust. Retail investors have balanced the volatility caused by foreign flows.  However, we should not forget that inability to imagine the trigger doesnot mean we can avoid one. When valuations are high, margin of safety low, and the world interlinked to the extent as it is today, smallest adverse events can cause default, credit contraction, foreign exchange fluctuation, war or pandemic. In fact, these have been the triggers for past crashes.

So, what do we do….

How do we solve for this dilemma? We continue to stick to reasonably priced quality companies. In most bubbles including current one, there remain some pockets that are of good quality and are not as exuberant. We have been adding weights there (shared in this and past letters). Once our target weights are allocated to these positions, we park the balance in liquid/ arbitrage funds. On selling side, we will tolerate moderate overvaluations. We will trim gradually if overvaluation is very high.

This strategy, like every other strategy, is not full proof. If the markets were to crash tomorrow, our stocks will fall too. We have, with great care and discipline, built a quality portfolio which is reasonably priced. It is our belief, and history is a testament that such quality portfolio built at reasonable price will be first to recover. Moreover, our high spare cash will be useful in buying further. And if there is no crash, our incremental deployment will slow down due to lack of opportunities, cash reserves will build up, existing positions will continue to benefit and we may trim super expensive positions. STANCE: Cautious.


A. PERFORMANCE


A1. Statutory PMS Performance Disclosure

Portfolio YTD FY25 FY24 FY23  FY22 FY 21  FY 20* Since Inception* Outper-formance Cash Bal.
CED Long Term Focused Value (PMS) 8.9% 29.2% -4.3% 14.9% 48.5% -9.5% 16.0% 22.0%
S&P BSE 500 TRI (includes dividends) NA^ 40.2% -0.9% 22.3% 78.6% -23.4% NA^ NA^ NIL
*From Jul 24, 2019; Since inception performance is annualised; Note: As required by SEBI, the returns are calculated on time weighted average (NAV) basis. The returns are NET OF ALL EXPENSES AND FEES. The returns pertain to ENTIRE portfolio of our one and only strategy. Individual investor returns may vary from above owing to different investment dates. Annual returns are audited but not verified by SEBI. W.e.f. April 01, 2023 SEBI requires use of any one from Nifty50, BSE500 or MSEI SX40 as a benchmark. We have chosen BSE500 as our benchmark as it best captures our multi-cap stance. ^BSE has stopped sharing index values for time being.


Persisting with the discipline

We continue to focus on risk with a complete blind eye to quarterly returns in today’s heady times. This involves double checking our thesis every day, saying no to poor quality or expensive ideas and investing in acceptable positions gradually and fearfully.

Such has been the velocity of the markets currently that stocks that we have rejected due to subpar quality and/ or high price continue to rise relentlessly. The immediate emotional reaction, naturally, is of missing out. However, thanks to our direct and vicarious experiences, we have learnt to ignore these first impulses that the market like current one triggers. 


A2. Underlying business performance


Past Twelve Months Earnings per unit (EPU)2 FY 2024 EPU (expected)
Mar 2024 8.61 8.5-9.53
(guidance was –>) (7.5-8.5)  
Dec 2023 (Previous Quarter) 8.0
Mar 2023 (Previous Year) 5.9
Annual Change 45.8%
CAGR since inception (Jun 2019) 15%
1 Last four quarters ending Dec 2023. Results of Mar quarter are declared by May only. 2 EPU = Total normalised earnings accruing to the aggregate portfolio divided by units outstanding. 3 Please note: the forward earnings per unit (EPU) are conservative estimates of our expectation of future earnings of underlying companies. In past we have been wrong – often by wide margin – in our estimates and there is a risk that we are wrong about the forward EPU reported to you above. 


Trailing Earnings: We had revised the Earnings Per Unit guidance for FY24 to Rs 7.5-8.5 last quarter. That was due to sale of two positions where earnings were at cyclical high. Actual trailing earnings per share for FY24 came in at Rs 8.6, marginally above the upper range of the guidance. Trailing twelve months Earnings Per Unit (EPU) of underlying companies, grew by 46% (including effects of cash equivalents that earn ~6%). 

1-Yr Forward Earnings: We introduce FY25 forward earnings per unit guidance at Rs 8.5-9.5.


A3. Underlying portfolio parameters


Jun 2024 Trailing P/E Forward P/E Portfolio RoIC Portfolio Turnover1
CED LTFV (PMS) 24.5x 22.0x-24.5x 34.0%3 Nil
BSE 500 26.2x2 15.5%2
1 ‘sale of equity shares’ divided by ‘average portfolio value’ during the year to date period. 2Source: BSE. 3Portfolio Return on Invested Capital (RoIC) is on core equity positions. For BSE we share the RoE (Return on Equity)


B. DETAILS ON PERFORMANCE

B1. MISTAKES AND LEARNINGS

We continue to hold the arbitrage position in equity and preference shares of Music Broadcast (Radio City). The position remains in the money currently. There were no mistakes to report in this period.


B2. MAJOR PORTFOLIO CHANGES

Bought: We added to an existing position . It is now a 5% position (major position). 


Sold: We did not sell anything in the reporting period.


B4. FLOWS AND SENTIMENTS

500x leverage in Weekly Options

India has seen sharp surge in derivatives volumes in last few years. India’s derivatives volumes accounted for over 80% of global derivatives volumes in April 2024. Last quarter, the average daily notional options volume of Nifty 50 contract in India (at 1.64trn$/ day) crossed that of US S&P 500 contract (1.44trn$/day). In fact, derivatives volumes are 400x of equity cash volumes in India, an all-time high both in India and the world.

The main contributor for this surge is weekly expiring options, also known as, zero-day options.

Option premium usually falls as time to maturity falls. Therefore zero-day option – that expires on the same day as bought – costs roughly one tenth of a traditional monthly-expiry options. One Nifty-50 zero-day option allows a buyer to have an exposure worth Rs 5 lacs by paying an option premium of just Rs 1,000 – a 500x leverage.

A 500x leverage magnifies gains and losses by 500 times. A 1% change in Nifty 50 can turn Rs 1000 into Rs 6000.  Conversely even a 0.2% fall in Nifty-50 can wipe out the premium. Surprisingly, this leverage which has grown manifold remains uncaptured in periodic debt statistics – money supply, gross advances, debt to GDP etc.

For newer traders that have seen rising prices and low volatility, weekly options have been the goose that lays golden eggs. But in reality, these speculative instruments are more like collecting pennies on a busy highway, or living in a rent-free home in a high-seismic zone. Once the prices start falling, most of the retail traders will incur capital losses. 

—–

 Taking Temperature

We use some qualitative indicator to take the temperature of markets and get hints of where are we in the cycle.

Retail and HNI investors continue to chase past performance. Capital market flows remain extremely buoyant as evident from multiple data points:

  • In last twelve months, of the INR 2.3 trn that flew into equity mutual funds (MF), over 50% went into smallcap, midcap and thematic funds which were already very expense. A sizable part of these MF inflows came from new fund offers (NFOs). NFOs are launched when the theme has already done well. No surprise that around 60% of NFOs have underperformed their benchmarks in last 3 years.
  • IPO pipeline (Hyundai, OLA Electric, Bajaj Housing etc.) is indicating 2024 will again record near all-time high collections.
  • SME IPOs continue to break records in terms of number of issues, extent of oversubscription, amount raised and listing pops. Versus Rs. 4900cr in CY2023, SME IPOs have already raised Rs. 3600cr in first half of CY2024. Also, the SME IPO index is up 250% in last 12 months! Most of the underlying companies have ordinary businesses and unknown corporate governance history.
  • Promoters and insiders continue to offload their stakes and cash out at loft vallations. Over 440 promoters have sold stakes worth Rs 62,000 cr in the first half of CY2024, highest since 2019.


Another interesting data point to look at is Skyscraper construction. The underlying theory is that many of the iconic skyscrapers of past have coincided with top of financial cycle. The Empire State Building in New York City was started in 1929. The Petronas Twin Towers in Kuala Lumpur were started in 1993. The Jailing Tower in Shanghai was started in 1995. Burj Khalifa was finished at the height of the market collapse in Dubai. In India, Imperial I &II (840ft each), the then tallest buildings, were built in Mumbai in 2010. Over 30 skyscrapers (600ft+ height) have been completed in last 3 years in Mumbai. Construction of even taller buildings (Ocean Power 1&2 1086ft, Aaradhya Avaan, 1000ft high) are underway right now.


C. OTHER THOUGHTS

Manias and Panics – Lessons from last 400 years


“I can calculate the movement of stars, but not the madness of men.”

Sir Issac Newton (after losing money in the South Sea Bubble, 1720)


Financial bubbles and crashes have been a frequent occurrence throughout the recorded world history. Almost all have led to bankruptcies, job losses, and financial distress.  If meltdown of bubbles is so painful, why can’t we stop them? Won’t it be better if prices remain etched to the financial worth of underlying securities/ assets, and owners earned the natural yields of those assets?

We scanned over 10 episodes of bubbles and crashes of last 400 years – including Tulip Mania of 1636, the Great Depression of 1929, the Dot Com bubble of 1999, the Sub-prime crisis of 2008 etc – to try and understand the causes of bubbles and crashes. The objective was to pull out/ revise lessons that today’s enthusiastic investors can learn from and avoid similar mental and financial toil.

Initial Rational Source: In almost all the bubbles of last 400 years, one or more of the following were the initial source(s) of economic exuberance:

SN Initial Rational Sources Examples
1 Inventions/ Productivity growth o    US 1920s (railways, radio, automobiles),

o    US Tech Bubble 1990s (internet)

2 Expansion of credit, excessive leverage, easy money, low interest rates o    Japanese Real Estate 1980s,

o    US Subprime Crisis 2000s,

o    Global Venture Capital boom 2015-2022

3 Globalisation, exports, cheap currency o    Japanese Real Estate 1980s,

o    South East Asia 1990s,

o    China 2000s

4 Economic Reforms/ Liberalisation o    Mexico 1980s,

o    US abandoning the Gold Standard 1970s,

o    India Harshad Mehta episode 1990s

5 Monopolies o    South Sea Bubble 1720,

o    Mississippi Bubble 1720


Most of the above measures were taken in pursuit of progress and economic well-being. And most of these measures were justified reasons for imagining a brighter future. They did improve lives and general wealth.

Wealth Effect: Anticipation of higher demand and growth due to above initial events leads to rise in asset prices. Banks get comfortable lending funds against security of these inflating assets. Raising money through equities become cheaper. Easy availability of both debt and equity capital at low cost of capital encourages capital investments and job creation. This raises incomes and thereafter consumption. The wealth effect thus feeds itself. 

Greater Fool Theory: What turns initial optimism into euphoria and bubble is the over estimation of brighter future, animal spirits and emotional outburst of greed, envy and fear of missing out (FOMO). Wealth effect leads to general sense of prosperity. It triggers envy and FOMO among sideliners. Prices start to detach from underlying reality. People buy in the hope that others may buy from them at even higher price – the Greater Fool Theory. Indian smallcaps, midcaps and a few sectors seem to be going through this stage currently.

Timing the top: Sadly, sooner or later the supply of greater fools run out. Some external event happens that makes prices to first stop rising and then start falling. Those not able to service debt or expenses are forced to liquidate falling assets. Gradually greed turns to fear and wisdom of crowds turns into stampede of folly. If we try to pick clues about being able to time the peaks, we will return disappointed. For, there is no upper range of time in months when a bubble pops. However, sooner or later, it does pop. Following have been one or more common crash triggers/ escalators of the past:

SN Crash Triggers/ Escalators Examples
1 Frauds or Swindles o    Enron/ Worldcom During US Tech Bubble 1990s,

o    Satyam, India 2008

2 Default or Bankruptcies o    US Maring Debt 1920s,

o    South East Asian Crisis 1997,

o    Lehman Brothers 2008,

o    IL&FS default 2018

3 Contraction of credit or money supply o    Japanese Real Estate 1980s,

o    US Tech Bubble 1990s

4 Geo-Politics, Terrorism, War o    Yom Kippur War and Oil Crisis 1973,

o    9/11 Attack 2001

5 Natural Calamities including Pandemics o    Spanish Flu, 1918,

o    Covid -19, 2020


 Saviour: Primary protection against emotional follies of envy, greed, fear of missing out and overconfidence in an overheated market is to remember what Benjamin Graham and Warren Buffett said about bubbles and human nature –

“The investor’s chief problem, and even his worst enemy, is likely to be himself”

“Be fearful when others are greedy”

***

As always, gratitude for your trust and patience. Kindly do share your thoughts, if any. Your feedback helps us improve our services to you!


Kind regards,

Team Compound Everyday Capital

Sumit Sarda, Surbhi Kabra Sarda, Punit Patni, Arpit Parmar, Sanjana Sukhtankar and Anand Parashar

————————————————————————————————————————————————————————————————-

Disclaimer: Compound Everyday Capital Management LLP is SEBI registered Portfolio Manager with registration number INP 000006633. Past performance is not necessarily indicative of future results. All information provided herein is for informational purposes only and should not be deemed as a recommendation to buy or sell securities. This transmission is confidential and may not be redistributed without the express written consent of Compound Everyday Capital Management LLP and does not constitute an offer to sell or the solicitation of an offer to purchase any security or investment product. Reference to an index does not imply that the firm will achieve returns, volatility, or other results similar to the index.


Continue Reading